This report presents an analysis of the physical building attributes acquired from the enumeration survey (May-2011) and a field verification survey (August-2011). The physical attributes analysed in this report include: MTPTC tag, building plot status, number of storeys, plot length and area, and plot area.
Methodology The enumeration survey recorded the status of the building plots in May-2011. A verification survey was then conducted by national staff in August-2011. A comparison of the two survey results using pivot table analysis showed significant differences between the two surveys. Some of the changes were due to genuine progress and change on the building plot between the two surveys – for example, destroyed buildings had been cleared to become clear plots and some damaged buildings had been replaced with T-shelters. In some cases data was available from one survey but not the other and in other cases, results from the two surveys were unexplainably different.
To produce the most comprehensive and accurate analysis of the data the results from the two surveys were matched and merged using ArcGIS. Table 1 presents the rules used to merge the two datasets:
| Condition | Rule applied to the database |
| No difference in the data between May-2011 and August-2011 | No change was made to the plot attribute |
| Data available for May-2011 but not available for August-2011 | The data from May-2011 was used |
| Data available for August-2011 but not available for May-2011 | The data from August-2011 was used |
| The data from May-2011 and August-2011 do not match | The verification survey results from August-2011 were used as they were assumed to provide the most accurate, up-to-date representation of the plot attribute. |
| No data available from May-2011 or August-2011 | Plot marked as having ‘no data’ |
Table 1: Rules used to merge the May-2011 and August-2011 datasets.
3. Results
a. MTPTC Tag
After the earthquake teams of engineers tagged buildings in Port-au-Prince ‘Green’, ‘Yellow’ or ‘Red’ according to their level of safety. Red-tagged buildings were deemed to be unsafe and green-tagged buildings safe.
Table 2 shows the number of tagged and untagged buildings in the database. Only 20% of buildings remain untagged. Of the 400 tagged buildings, 206 (51%) are red, 116 (29%) yellow and 78 (20%) green.
|
| Untagged | Green | Yellow | Red |
| Number of Buildings | 98 | 78 | 116 | 206 |
| Percent | --- | 50 | 291 | 51 |
Table 2: The revised number and percentage of tagged and untagged buildings.
MTPTC and Building Status
When a building tag was not available from either the May-2011 or August-2011 survey results, information from the building status attribute was used to explain the status of the plot. Those plots not assigned a MTPTC tag were found to be recorded as being either ‘damaged’, ‘new construction’, T-Shelter’ or ‘Clear Plot’ (see Table 3).
| Status | Number | Percent |
| Damaged | 12 | 12 |
| New Construction | 8 | 8 |
| T-Shelter | 23 | 23 |
| Clear Plot | 30 | 31 |
| No Data | 25 | 26 |
Table 3: Status of building plots not assigned a MTPTC tag.
As a result of this analysis only 25 plots in the database now have no tag or building status.
Some of these are known to be non-residential buildings - including the office, public latrines and the church – which explains why data has not been recorded for them. These non-residential buildings will be removed from the database.
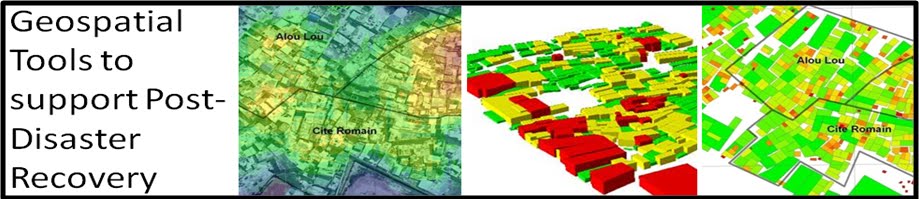
Figure 1 provides the most up-to-date map of MTPTC status in Delmas 19 currently available. Of the 400 tagged buildings, 206 (51%) are red, 116 (29%) yellow and 78 (20%) green.
There are 98 plots untagged, of these 8 are new constructions, 23 T-shelters and 30 clear plots.

Figure 1: MTPTC tags recorded in Delmas 19.
Table 4 presents a breakdown of MTPTC tag by Cite.
| MTPTC Tag |
|
|
| Not Tagged | Green | Yellow | Red | Grand Total |
| Alou Lou | 9 | 23 | 29 | 22 | 83 |
| Cite 4 | 37 | 18 | 42 | 108 | 205 |
| Romain | 38 | 19 | 27 | 38 | 122 |
| St Ange | 14 | 18 | 18 | 38 | 88 |
| Grand Total | 98 | 78 | 116 | 206 | 498 |
Table 4: Number of buildings with Green, Yellow and Red Tags in each Cite.
b. Building Status
In May and August 2011 the status of the building plots was recorded. Definitions for each ‘status’ are provided below:
· Safe: existing building still-standing and deemed safe
· Damaged: building still-standing but in a damaged state
· Destroyed: building still standing but not habitable
· Empty Plot: building cleared from plot
· New construction: new building constructed on site
· T-Shelter or Tent: the site contains a t-Shelter or a tent
54% of building plots were classified as either ‘damaged’ or ‘destroyed’, which correlates closely to the proportion of buildings tagged red (51%).
68 buildings were described as ‘safe’ (of those 65 were tagged green, 1 yellow and 2 red).
There were only 14 ‘new constructions’.
39 T-shelters were also recorded. These were erected by UNOPS at the end of 2010.
Building status is summarised in table 6 and figure 4.
| Row Labels | Damaged | Destroyed | Empty Plot | Tshelter or tent | New Construction | Safe | No Data | Grand Total |
| Alou Lou | 28 | 16 | 8 | 3 | 4 | 21 | 1 | 1 |
| Cite 4 | 29 | 86 | 37 | 16 | 6 | 18 | 20 | 20 |
| Romain | 31 | 26 | 19 | 13 | 2 | 12 | 15 | 15 |
| St Ange | 21 | 30 | 5 | 7 | 2 | 17 | 5 | 5 |
| Grand Total | 109 | 158 | 69 | 39 | 14 | 68 | 41 | 498 |
Table 6. Building plot status.

Figure 4: Building plot status.
c. Change in Building Status between May and August 2011
Change detection analysis was used to monitor change in building status between May-2011 and August 2011. The changes in building plot status are summarised in Table 7.
|
|
| Building Status August-2011 |
|
|
|
| Empty Plot | Damaged | Safe | New Construction | T-Shelter or tent | N/A | Grand Total |
| Building Status May-2011 | Empty Plot | 27 | 19 | 1 | 0 | 4 | 6 | 57 |
| Damaged | 21 | 171 | 43 | 5 | 3 | 49 | 292 |
| Safe | 1 | 3 | 19 | 2 | 4 | 12 | 41 |
| T-shelter or tent | 9 | 13 | 1 | 0 | 25 | 4 | 52 |
| Under Construction | 0 | 0 | 0 | 4 | 0 | 0 | 4 |
| N/A | 7 | 12 | 4 | 3 | 3 | 23 | 52 |
|
| Grand Total | 65 | 218 | 68 | 14 | 39 | 94 | 498 |
Table 7: Change in building status between May and August 2011.
Empty Plots
Of the 57 empty plots recorded in May-2011, 27 (47%) remained clear. 4 had t-shelters constructed on them but there were no new constructions. The change detection analysis identified some inconsistencies in the data collection. For example, 19 plots were marked as ‘clear’ in May-2011 and ‘damaged’ in August-2011. It is difficult to explain how a site might have changed from clear to damaged.
Damaged Plots
The majority of damaged plots (171 out of 292, 59%) remained damaged in August-2011.
The results suggest that in total 218 buildings are still in a damaged state.
43 (15%) plots were converted from a damaged state to a safe state and 21 (7%) were cleared to become empty plots
5 of the damaged plots (2%) now have new constructions on them and 3 have a T-shelter.
Safe Plots
Of the 41 safe plots recorded in May, 19 (46%) remained in a safe state. 1 was cleared and 3 were re-labelled as damaged; 2 (5%) had new constructions and 4 (10%) had T-shelters.
T-shelters
The total number of T-shelters dropped from 52 to 39. 48% of the original T-Shelters remained. 9 had apparently been cleared and 13 were recorded as in a damage state.
14 new t-shelters were added between May-2011 and August-2011 to sites that were empty, damaged or classified as safe in May.
Under Construction
All 4 buildings under construction were recorded as complete in August-2011.
Summary
There appears to have been only a small amount of construction in the target area between May and August 2011. There were only 14 new constructions recorded in August. Most of the construction occurred on sites that were marked as damaged or under construction in May-2011. 218 buildings were marked as still being damaged in August. The results suggest that the total number of T-shelters has reduced.
d. Number of storeys Figure 2 and table 5 present the number of storeys in each Cite.

Figure 2: Number of storeys in each Cite
32 (6%) of buildings were recorded as having no floors or as N/A.
Of the 389 buildings with storey information recorded: 76% had one-storey, 22% two-storeys and 2% three-storeys.
Of the 11 three-storey buildings recorded 7 were in St Ange and 3 were in Romain.
| Number of Storeys |
|
|
| 0 | 1 | 2 | 3 | 5 | Grand Total |
| Alou Lou | 2 | 66 | 15 | 0 | 0 | 83 |
| Cite 4 | 18 | 164 | 22 | 1 | 0 | 205 |
| Romain | 8 | 65 | 45 | 3 | 1 | 122 |
| St Ange | 4 | 58 | 19 | 7 | 0 | 88 |
| Grand Total | 32 | 353 | 101 | 11 | 1 | 498 |
Table 5: Number of storeys in each Cite.
Figure 3 shows a three-dimensional model of Delmas 19 to help visualise the differences in building height across the target area. A 3-D KMZ file is also provided which can be viewed in Google Earth.

Figure 3: Three-dimensional model of building height in Delmas 19 target area.
e. Plot width and length
A script was used to calculate the width and length of each building plot in the GIS. Table 6 presents summary statistics for Delmas 19. A full table containing length and width for every building plot is also available and will be used as part of a preliminary costing exercise.
| Short-axis | Long-axis |
|
| Min | Max | Average | Min | Max | Average |
| City 4 | 2.1 | 21.2 | 5.0 | 2.5 | 32.8 | 7.6 |
| City Aloulou | 3.4 | 34.8 | 6.7 | 4.2 | 53.4 | 10.1 |
| City Roman | 2.1 | 10.3 | 5.7 | 3.9 | 16.2 | 9.0 |
| City Saint-Ange | 1.7 | 19.7 | 6.2 | 2.5 | 39.0 | 10.3 |
Table 6: Length and width summary statistics for Delmas 19.
f. Plot Area
Table 7 present building area statistics for the target area. The classifications used in table 8 have been acquired from the BRC report ‘D19 House Design Criteria’.
54% of buildings are over 33m² and 17% are under 19m².
72% of buildings under 19m² are located in Cite 4. Only 2 buildings between 0-19m² are in AlouLou and only 8 in Romain.
| House Plot (m²) | Total Number | % | Cite 4 | Alou Lou | Romain | Saint Ange |
| >33 | 270 | 54 | 65 | 68 | 83 | 54 |
| 29.5 to 33 | 32 | 6 | 15 | 2 | 10 | 5 |
| 26 to 29.5 | 43 | 9 | 23 | 6 | 8 | 6 |
| 22.5 to 26 | 35 | 7 | 22 | 2 | 6 | 5 |
| 19 to 22.5 | 35 | 7 | 20 | 3 | 7 | 5 |
| 0 to 19 | 83 | 17 | 60 | 2 | 8 | 13 |
Table 7: Building area statistics for the target area.
 Food is provided for us at breakfast and at lunchtime. The kitchen is currently headed by a Danish chef - the food is fairly basic but there's always plenty of fruit and veg so I can't complain. The food in the supermarkets is very expensive - almost three times as high as I would pay in the UK so I'm very grateful that the Red Cross provide this service. The picture below shows part of the eating area. Apparently during the Emergency Phase the Italians provided the food and I was surprised to hear many people complained that it wasn't very good!
 Many of the Federation and nation staff must work and live on base camp. For the past year and a half those staff members have had to live in tents without air conditioning which must have been extremely uncomfortable. Recently, shelters have been provided for the staff containing all the basic amenities.
 I was amazed to see that some of the teams are working in these dome-shaped shelters. Even more incredible is that I've seen several of them being used by beneficiaries in Port-au-Prince. They really are ugly and totally inpractical.
 Whilst cholera still has a presence in the country hand-washing is an absolute must after using the loo and before and after every meal:
 These are the converted shipping containers that we work in. They're not terribly spacious, but they have sufficient light and air-conditioning. There is a separate container for each of the project's teams: logistics, finance, shelter, watsan, livelihoods and communiications.
 I work closely with the shelter delegate and the head of delegates. On a day-to-day basis I also work very closely with the national staff to provide support and technical guidance. They're a really great team of people: very hard-working with an eye for detail.
 And finally, here's one of the British Red Cross vehicles waiting to take us back home at the end of a busy day:


