
One of the key objectives of my work in Haiti is to try and better understand how a recovery programme operates on the ground and in particular, to identify the common decision-making processes at various stages of a response. The diagram below shows a common British Red Cross programme framework. In reality though, each project will be very different to the other due to differences in the cultural context, the extent of damage and the objectives/content of the programme itself. Different executing agencies (NGOs, governments, donors) may also have different approaches to recovery and use very different time-frames.
 The BRC project I am assisting is a small-scale integrated programme consisting of shelter, logistics, WATSAN and livelihoods in a complex urban setting. The decision-making process for this type of project will therefore be quite specific to the project and is constantly evolving. Based on my knowledge of the project to-date I have started to map out the key components. This is presented as a flow-diagram below; I hope to use the final version of this diagram as the structure of my final report:
 Initial Damage Assessment
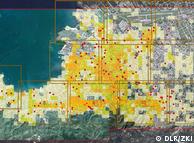
Immediately after a disaster there is often a rapid survey of damage and needs assessment. In recent years remote analysis of satellite imagery, aerial imagery, pictometry and/or lidar has been increasingly used to provide an overview of the amount and extent of damage immediately after a disaster. The final estimated direct loss for the housing sector in Haiti derived from the remote damage assessment was US$6.1 billion. My Colleage, Dr Keiko Saito, recently explored the accuracy of these techniques using ground-derived damage datasets. Overall, using oblique Pictometry images 67% of structural damage (EMS-98 Levels 4 and 5) was identified.
 Detailed Assessment, Planning and Project Design
As soon as the capacity is ready a detailed survey of building damage is often then conducted on the ground. In Haiti this was done by the Ministere des Travaux Publics Transport et Communications (MTPTC) and was published on 13 August 2010. Buildings were tagged red, yellow or green according to their level of safety. According to the ATC Guidelines (on which the MTPTC tagging was based) the tagging process is “not a damage survey, but an assessment of whether the building is safe for entry or occupancy”. As a result green-tagged buildings can be deemed ‘safe’ but might still be damaged and/or seismically vulnerable when another earthquake occurs.
In Delmas 19 it is estimated that around 350 houses (60%) are red-tagged. It was assumed that the red-tagged structures were likely to be the most vulnerable and as a result might need to be prioritised during the selection process. To verify the damage tags Dr. Regan Potangaroa and Rafael Mattar Neri carried out a study of structures in Delmas 19. They found that out of 10 red-tagged buildings 3 were confirmed as red, 4 were in fact yellow and 3 were green. These results suggest that the tagging was not accurately applied by MTPTC and/or the status of some buildings had changed since the survey. My own analysis of the MTPTC data also shows the data to be inaccurate in terms of location and coverage – as there are many untagged buildings in Delmas 19. A more detailed technical survey is therefore advised both to re-assign more descriptive damage levels and to survey untagged buildings.
 Detailed Project Planning and Design
Once an agency has a grasp on the losses sustained during a disaster they may decide to design a project or series of projects in the affected region. If these project proposals are approved an implementation team set-up in the area and begin to plan the detailed design of the programme. At this stage, there are numerous participatory and non-participatory data collection processes that might take place to help staff measure and describe the baseline situation in the target area and to identify possible problems and solutions. These tools include participatory tools and non-participatory tools, including detailed mapping and surveying:
Participatory Tools
PASSA (Participatory Approach to Safe Shelter Awareness) is a participatory tool that allows communities to improve their living environment, build safer shelters and design better settlements. It was developed by the International Federation of Red Cross and Red Crescent Societies (IFRC) together with British Red Cross. It consists of a series of meetings with a group of 40 or so community representatives that identify problems and solutions and results in the development of a community action plan.
 Non-Participatory Tools
The non-participatory tools include physical and social surveying, as well as technical and non-technical observations on the ground:
a. Cadastral Survey – records the location and size of the owners’ plots using high-accuracy GPS equipment.
b. Enumeration survey – contains detailed information on ownership status, family situation and social-economic vulnerability.
c. Engineer survey and observations – identifies the damage type(s) and the repair/reconstruction options that are available.
d. Architect observations on living conditions, how families use their space, where and when they use the toilets, thermal properties, accessibility etc.
The data from the non-participatory and participatory techniques can all be triangulated against each other to ensure high accuracy and full-coverage. I am currently exploring how these various datasets may be stored in a GIS and used to cross-reference each other to assist with the decision-making process.
Beneficiary Selection
Based on the results from these different data-collection exercises the team will construct an understanding of the situation in Delmas 19 and the key problems there. They will then be ready to create a suite of options for different household situations. The community must then decide and agree on how the funding should be used. There is only limited funding so there might not be enough to assist everyone depending on the recovery strategy selected. Having to choose some households over others will be an extremely difficult and challenging decision to have to make.
There are many questions that will need to be addressed over the next couple of months before the project can commence. For example, will BRC favour repair solutions over reconstruction? Will they only assist those living in red-tagged buildings? What happens if a structure contains owners, renters or both? Is it feasible to reconstruct a 3-storey structure in the middle of the slum? Is it feasible to reconstruct in blocks? Will buildings or other features need to be demolished to acquire adequate accessibility?
The question of fair and equal allocation must also be addressed. All too often a group of beneficiaries might benefit from an aid intervention more than others, which can then create resentment and frustration within the community.
It is hoped that the GIS that we create might be able to assist the decision-making process by analyzing and visualizing these different sets of data to show the current status of Delmas 19 and to explore different ways that the funding could be spent. The analysis will take into account the physical and social status of each plot and could even take into account the spatial context of the area e.g. accessibility and whether the surrounding area is deemed dangerous or not. At the end of the day though, it will be the community who will decide and sign-off the decisions based on a series of recommendations.
No comments:
Post a Comment